
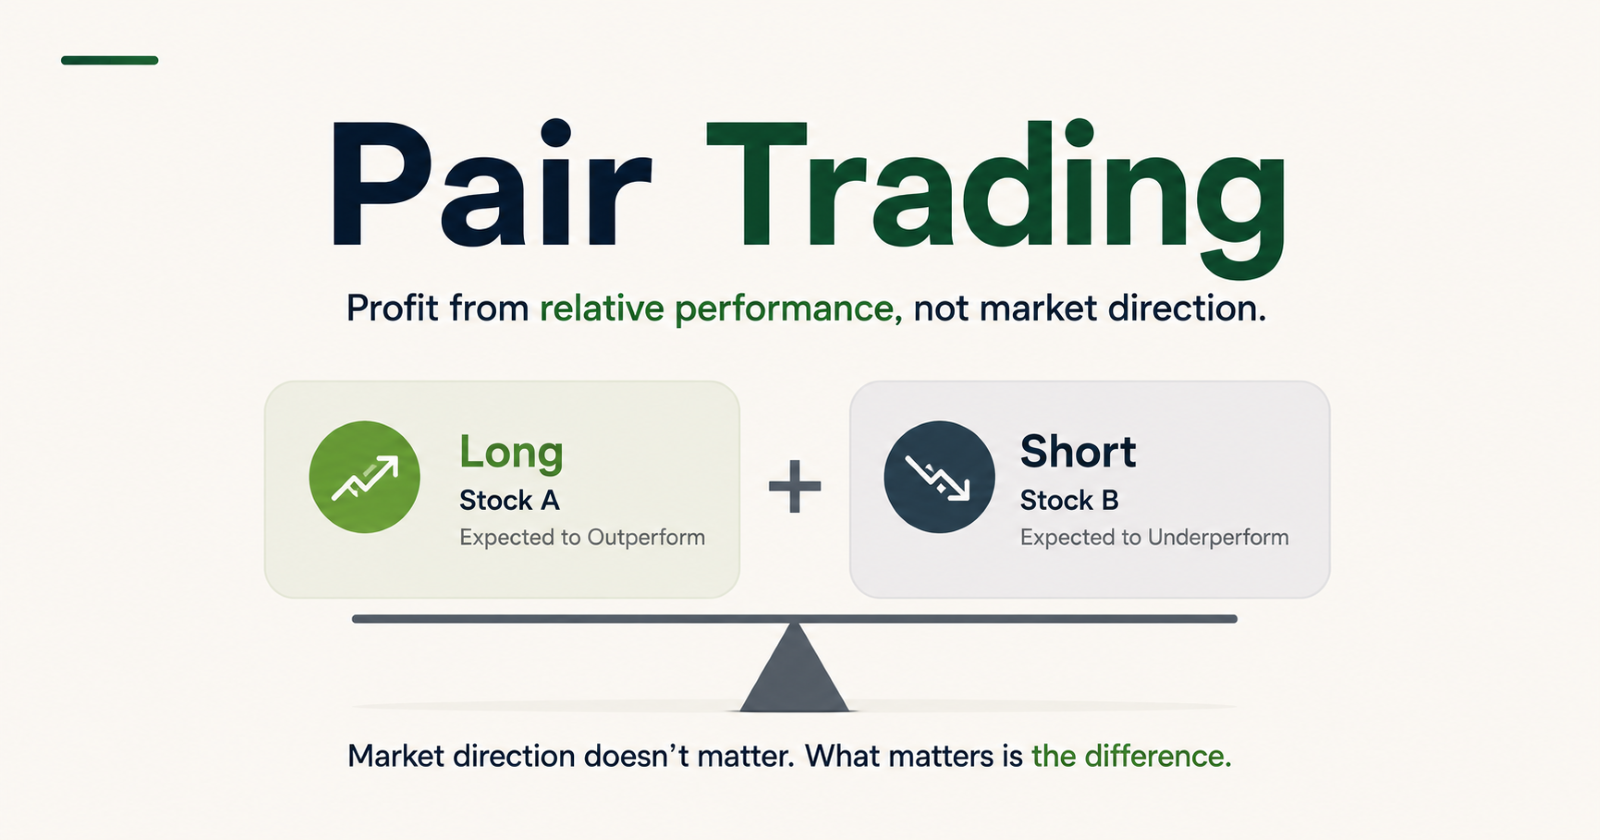
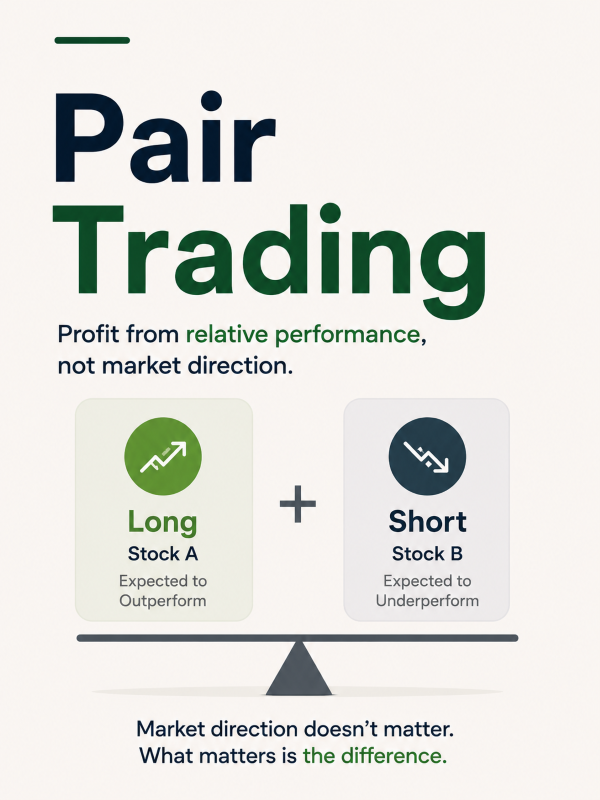
Most investment strategies make a bet on the market going up or down. Pair trading makes a different kind of bet entirely, that one stock will outperform another, regardless of which direction the market moves.
The structure is straightforward: the manager goes long on a stock expected to outperform and simultaneously goes short on a stock expected to underperform, both within the same sector or industry. The two positions work as a pair. If the long stock rises more than the short stock, the trade profits. If the long stock falls less than the short stock, the trade still profits. The overall market direction becomes largely irrelevant, what matters is the relative performance between the two stocks.
When Does an SIF Manager Use This?
A manager uses pair trading when they have a strong view on the relative performance of two companies within the same sector, not necessarily on the sector itself.
For example: within the banking sector, the manager may believe Bank A is undervalued relative to Bank B, perhaps because Bank A has cleaner asset quality, better loan growth, or a stronger management team, while both trade at similar valuations. The manager goes long Bank A and short Bank B. If the market eventually recognises this difference, Bank A outperforms Bank B and the trade profits, whether the banking sector as a whole goes up, down, or sideways.
Pair trading is also used to neutralise sector-level risk while expressing a stock-specific view. A manager who likes a particular pharma company but is uncertain about the broader pharma sector's near-term direction can go long that company and short a weaker peer, capturing the stock-specific alpha without taking on sector-level directional risk.
In the SIF context, the short exposure counts toward the 25% unhedged short limit permitted under the SEBI framework. The long leg can be held either in the cash market or through long futures. Per the SEBI circular, offsetting is permitted between cash and derivative positions on the same underlying, and between two derivative positions on the same underlying, but not between positions on two different stocks. The long and short legs of a pair trade on different stocks are therefore counted separately in the gross exposure calculation.
How It Plays Out
Setup: Manager goes long Stock A (Bank A) at ₹500, ₹5 crore position. Goes short Stock B (Bank B) via futures at ₹400, ₹4 crore short position. Both are in the banking sector.
Scenario | Long Stock A (Bank A) | Short Stock B (Bank B) | Net Impact |
A rises 15%, B rises 5% | Gains ₹75 lakh | Loses ₹20 lakh | Net gain ₹55 lakh |
A falls 5%, B falls 15% | Loses ₹25 lakh | Gains ₹60 lakh | Net gain ₹35 lakh, pair works in falling market too |
A rises 10%, B rises 10% | Gains ₹50 lakh | Loses ₹40 lakh | Near neutral, pair produces no alpha |
A falls 10%, B rises 10% | Loses ₹50 lakh | Loses ₹40 lakh | Worst case where both legs lose simultaneously |
Sector crashes, both fall 20% | Loses ₹100 lakh | Gains ₹80 lakh | Small net loss, pair largely protects |
The first two rows show the strategy working as intended, the manager was right on relative performance and profits regardless of market direction. The third row shows the scenario where the trade is simply neutral, both stocks move identically, no relative alpha is generated. The fourth row is the real risk, when the manager is wrong on both sides simultaneously. The long stock falls and the short stock rises, so losses compound on both legs. The fifth row demonstrates the structural resilience of pair trading: even in a sector crash, the short leg largely offsets the long leg's loss, with only a small net negative.