
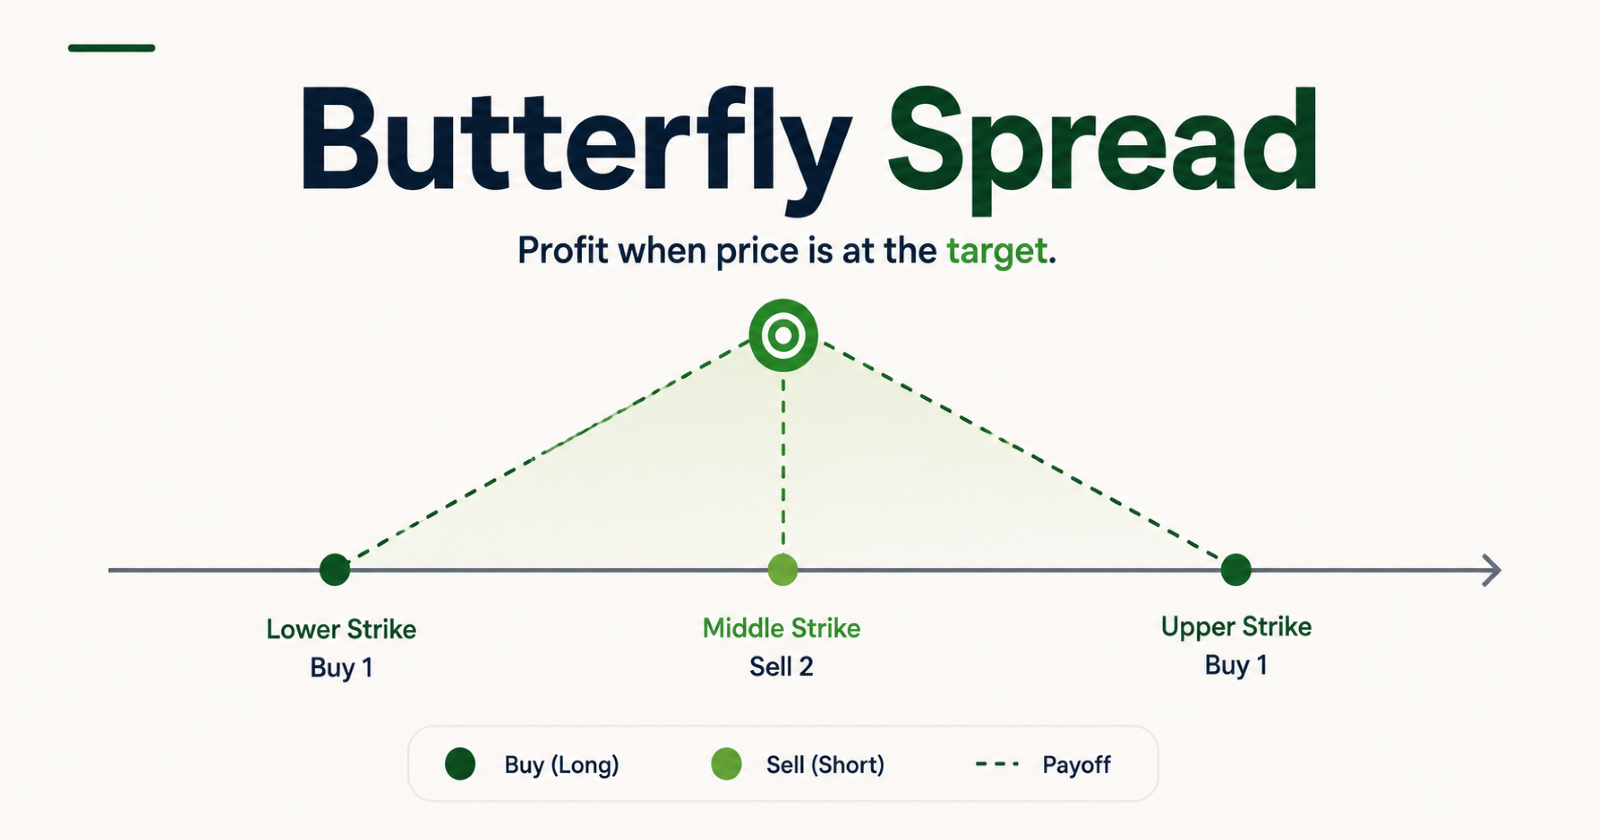
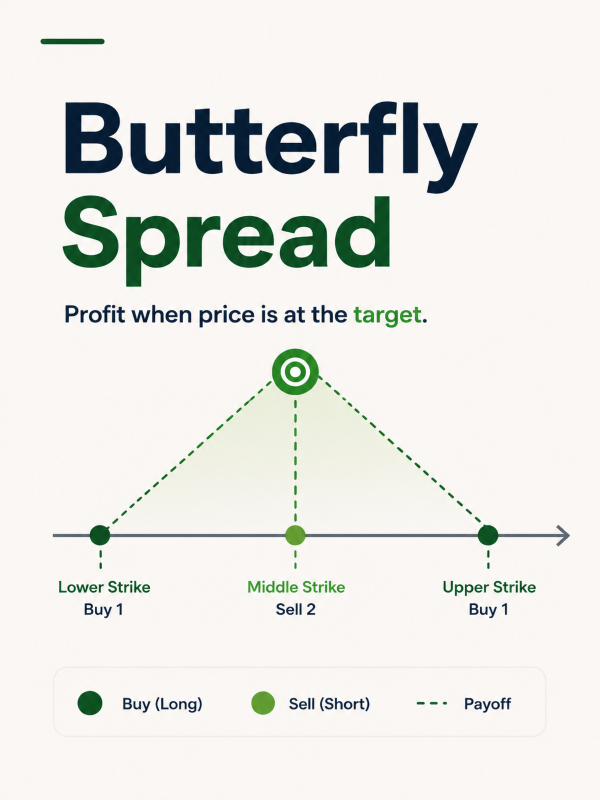
A butterfly spread is built for one specific view: the manager believes a stock will be at or very near a particular price at expiry, not just directionally bullish or bearish, but precise about the destination.
The structure combines three strikes: a lower strike, a middle strike, and an upper strike, with the middle strike being the target price. The manager buys one option at the lower strike, sells two options at the middle strike, and buys one option at the upper strike. All three are the same type (calls or puts) with the same expiry.
The sold middle options fund most of the cost of the two bought outer options. The result is a position with a very low net cost, a defined maximum gain exactly at the middle strike, and a defined maximum loss limited to the small net premium paid.
Long vs Short
Long Butterfly | Short Butterfly | |
Built by | Buy 1 lower strike + Sell 2 middle strike + Buy 1 upper strike | Sell 1 lower strike + Buy 2 middle strike + Sell 1 upper strike |
Profit when | Stock stays near middle strike | Stock moves far beyond either outer strike |
Loss when | Stock moves far beyond either outer strike | Stock stays near middle strike |
Max gain | At middle strike i.e. spread width minus net premium | Net premium received |
Max loss | Net premium paid | Spread width minus net premium received |
When Does an SIF Manager Use This?
Long Butterfly: Used when the manager has a very specific price target for a stock at a known future date, typically around an earnings release, a dividend record date, or a technical resistance level the manager believes will hold. It is also used when implied volatility is high, making standalone options expensive, because here the sold middle strikes significantly reduce the net premium cost.
Short Butterfly: Used when the manager expects significant movement away from the current price but is uncertain about direction, similar to a long straddle or strangle, but with a defined maximum loss rather than an open-ended one. By selling the outer strikes and buying the middle strikes, the manager profits from large moves in either direction while capping the downside at the spread width minus premium received.
How It Plays Out
Setup: Stock A trading at ₹2,500. Lot size 500. Long call butterfly: buy 1 call at ₹2,300 strike (premium ₹220), sell 2 calls at ₹2,500 strike (premium ₹120 each), buy 1 call at ₹2,700 strike (premium ₹60). Net premium paid = ₹220 − (₹120 × 2) + ₹60 = ₹40 per share. Total cost = ₹20,000 per butterfly.
Scenario | Long Call (₹2,300) | Short 2 Calls (₹2,500) | Long Call (₹2,700) | Net Impact |
Stock at ₹2,500 at expiry | Gains ₹200/share | Each loses ₹0 | Expires worthless | Maximum gain: ₹200 − ₹40 = ₹160/share |
Stock at ₹2,600 at expiry | Gains ₹300/share | Each loses ₹100 + ₹100 = ₹200 | Expires worthless | Gain: ₹300 − ₹200 − ₹40 = ₹60/share |
Stock at ₹2,700 at expiry | Gains ₹400/share | Each loses ₹200, net ₹400 | Expires worthless | Breakeven minus premium = ₹40/share loss |
Stock rises to ₹3,000 | Gains ₹700/share | Each loses ₹500, net ₹1,000 | Gains ₹300/share | Maximum loss: ₹40/share (net premium only) |
Stock falls to ₹2,000 | Expires worthless | Both expire worthless | Expires worthless | Maximum loss: ₹40/share (net premium only) |
The first and last two rows together tell the complete story of a long butterfly. The maximum gain sits exactly at the middle strike, where the manager's precise view is validated. Beyond either outer strike in either direction, the maximum loss is always capped at the small net premium, regardless of how far the stock moves. That defined, contained downside is the long butterfly's most distinctive feature.